---
date: 2026-11-10 00:00:00
slug: aqueduct-rate-limits
authors:
- dniederlechner
---
# New Rate Limits for Aqueduct: More Room for Bursts, a Cap on Marathons
Since Monday, 9 November 2026, Aqueduct has new rate limits. You can now send **twice as many requests per minute** as
before, and there is a new **hourly and daily limit** on top. We did not pick these numbers out of thin air: we went
through a week of Aqueduct's request log first. This post shows what we found and what the new limits mean for your
work.
## What changed
Until 8 November, every API key had a single limit: **25 requests per minute**, and nothing else. Now there are three:
| | Per minute | Per hour | Per day |
| ---------- | ---------: | ------------------------: | -------------------------: |
| **Before** | 25 | no limit (1,500 possible) | no limit (36,000 possible) |
| **Now** | **50** | **1,500** | **15,000** |
The hourly limit is 30 minutes' worth of the per-minute limit, and the daily limit 300 minutes' worth. In practice:
- **Bursts get twice the room.** A coding agent that fires off a quick series of requests is far less likely to be
refused with a `429`.
- **No hour gets less than before.** 25 requests a minute for a full hour was 1,500 requests, which is exactly the new
hourly limit.
- **The day has an end.** At most 15,000 requests a day, which is ten hours at the old full speed.
- **Model multipliers still apply.** A request to a model with `2x Limits`, such as `qwen-3.8-27b`, counts as half a
request against all three limits.
Each API key has its own limits. The minute and hour limits reset on the full minute and hour, the daily limit at
midnight UTC (01:00 in Vienna in winter, 02:00 in summer). When you hit one, Aqueduct answers with `429` and a
`Retry-After` header that tells your client how long to wait. The details are in the
[FAQ](https://datalab.tuwien.ac.at/aiml/faq/#how-are-rate-limits-calculated-and-when-do-i-get-a-429).
## One week of Aqueduct
We analysed Aqueduct's request log from **15 to 22 October 2026**. The log records when a request was sent, to which
model and how many tokens it used, but not what it said. Accounts were pseudonymised for the analysis, and no account
is named below. In that week, **222 accounts** (individual users and service accounts) sent **645,312 model requests**
(chat, completions, responses, embeddings, speech and images) with **35.5 billion input tokens** and **726 million
output tokens**.
### A few accounts send most of the requests
Usage is very uneven. The five busiest accounts sent almost half of all requests, and the twenty busiest 85%. Most of
them run scripts through an SDK or let coding agents work unattended. Chatting is a small part of it.
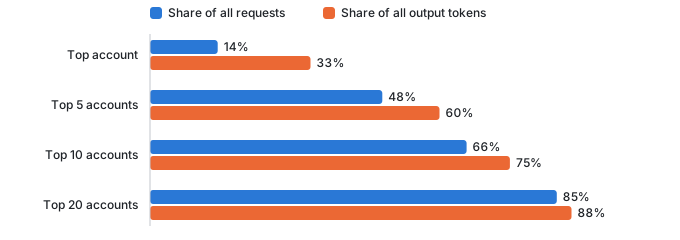
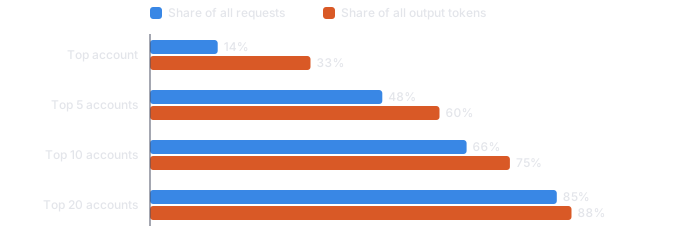
Share of the week's requests and output tokens from the busiest accounts, ranked separately for each
measure. 222 accounts in total.
### People work office hours, scripts work through the night
On weekdays, 45 to 50 accounts were active in each hour between 10:00 and 17:00, and only 10 to 16 at night. The
number of requests changed much less: at night there were still around 3,000 requests an hour, sent by about a dozen
accounts. Of the requests from the ten busiest accounts, only 26% fell within office hours. For everyone else it was
61%.
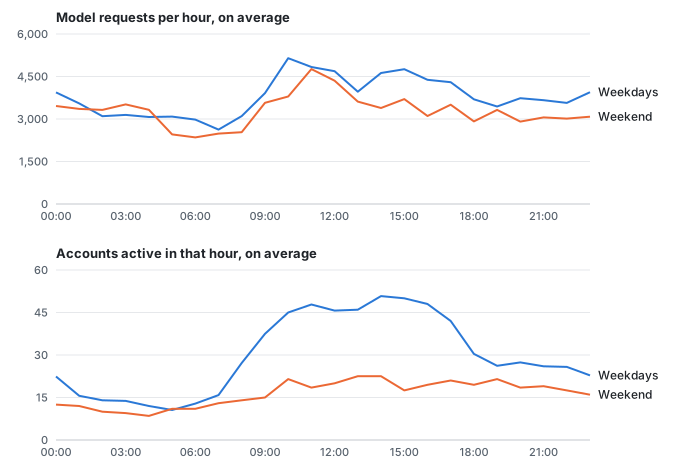

Average per hour of the day, Vienna time. The number of active accounts follows the working day,
the number of requests barely does.
### A typical account never comes close
For every account, we looked at its busiest 60 seconds, its busiest hour and its busiest 24 hours of the week. At its
busiest, the typical (median) account sent **12 requests in a minute**, **70 in an hour** and **127 in a day**. That
is a quarter of the new per-minute limit, and less than 5% and 1% of the hourly and daily limits.
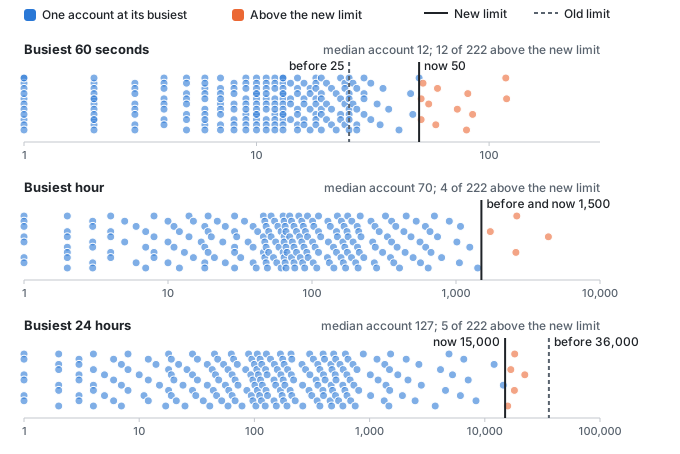

Each dot is one account at its busiest moment of the week, on a logarithmic scale. Orange dots are
above the new limit.
Only a few accounts reached the new limits: 12 in their busiest minute, 4 in their busiest hour and 5 on their
busiest day. Some accounts show more than 25 requests a minute although the old limit was in place. That is because
the chart counts all keys of an account together, over any 60 seconds, and includes models with `2x Limits`. The limit
counts each key and each calendar minute on its own.
We also replayed the week against candidate limits, to see how many requests each would have refused:
| Limit on its own | Accounts hit | Requests refused |
| ----------------- | -----------: | ---------------: |
| 30 per minute | 22 | 3.7% |
| 60 per minute | 6 | 0.5% |
| 1,000 per hour | 9 | 4.7% |
| **1,500 per hour** | **4** | **2.7%** |
| 10,000 per day | 7 | 14.2% |
| **15,000 per day** | **5** | **2.9%** |
The replay assumes that clients keep sending exactly as they did, so it is an upper bound: real clients wait and try
again. Tighter limits of 30 a minute, 1,000 an hour and 10,000 a day would have refused 16% of all requests, from 25
accounts, and would have started to hit coding agents during normal working hours. That is not what we want.
## What the limits mean in practice
The chart below follows a script at full speed through one day, before and now, next to a busy day of a coding
agent.


Requests sent over one day, added up. The two script lines illustrate a client that always sends
as fast as the limits allow. The coding-agent line is the 90th percentile of the week's busiest days.
**A coding agent at work.** Agents send requests in bursts while they work. In the minutes in which an account was
active, it sent 4 requests at the median and 31 at the 99th percentile. 50 a minute leaves room for that. Even a busy
coding day (the 90th percentile in our week) adds up to 1,757 requests, about 12% of the daily limit.
**A script at full speed.** A script that sends 50 requests a minute reaches the hourly limit of 1,500 after 30
minutes and waits for the next full hour. After ten hours it has used its 15,000 requests for the day. Under the old
limit, the same script could send 25 a minute around the clock, 36,000 requests a day.
**A large or long-running job.** If you need to process a lot of data, please
[ask us for a service account](https://datalab.tuwien.ac.at/aiml/faq/#i-need-more-capacity-for-a-large-job-what-can-i-do). Service accounts
have higher limits, and we can schedule large jobs so they don't take capacity away from everyone else.
Whatever you run, make sure your client honours `429` responses and the `Retry-After` header and does not retry
straight away.
## What request limits can't see
A request is not a fixed amount of work. The typical request in our week sent **50,448 tokens** and got **375** back.
Coding agents and scripts send the whole conversation or file context with every turn, so prompts of 64,000 tokens or
more make up 44% of the requests but carry 85% of all input tokens.


Answered requests that generated text, grouped by prompt size.
Two cases from the week show what counting requests misses:
- A client stuck in a loop sent a large number of requests to a model that no longer exists, and every one of them
was rejected. It sent them at a steady pace all day, slowly enough to stay under all three new limits.
- A single generation job wrote a large share of the week's output tokens while sending fewer than 50 requests a
minute, mostly at night.
Request limits are a guard rail against floods and runaway clients. They do not share the GPUs fairly between users.
That is the next thing we are working on: limits that only apply when a model is actually busy.
## Tell us how it goes
We will keep watching the numbers and adjust the limits as usage changes. If you run into them during normal work,
or if something here does not match your experience, let us know in the
[Matrix room](https://matrix.to/#/#llm-service:tuwien.ac.at).